There are lots of nice tutorials and explanations about curves and their use, therefore I will not repeat here things that others have explained at length and much better than I would. A very good resource is Patrick David's tutorial on the subject, which you can access here.
Here I will mostly focus on how to use curves in photoflow, and on how to create, modify and delete control points.
Photoflow's curves undisclosed
Let's start as usual by opening an existing image (in this example, the "american bison"): click on the "Open" button near the top-left corner of the main window and choose a file in the dialog that pops up.Now that we have an image at hand, let's see how to add a "Curves" adjustment. First of all, click on the "+" button at the bottom of the layers widget, switch to the "color" tab in the tool selection dialog and select the "Curves" tool from the list (see below).

Once you click on the "Ok" button, a layer is added on top of the one called "background" and a the configuration dialog for the curves tool is opened.
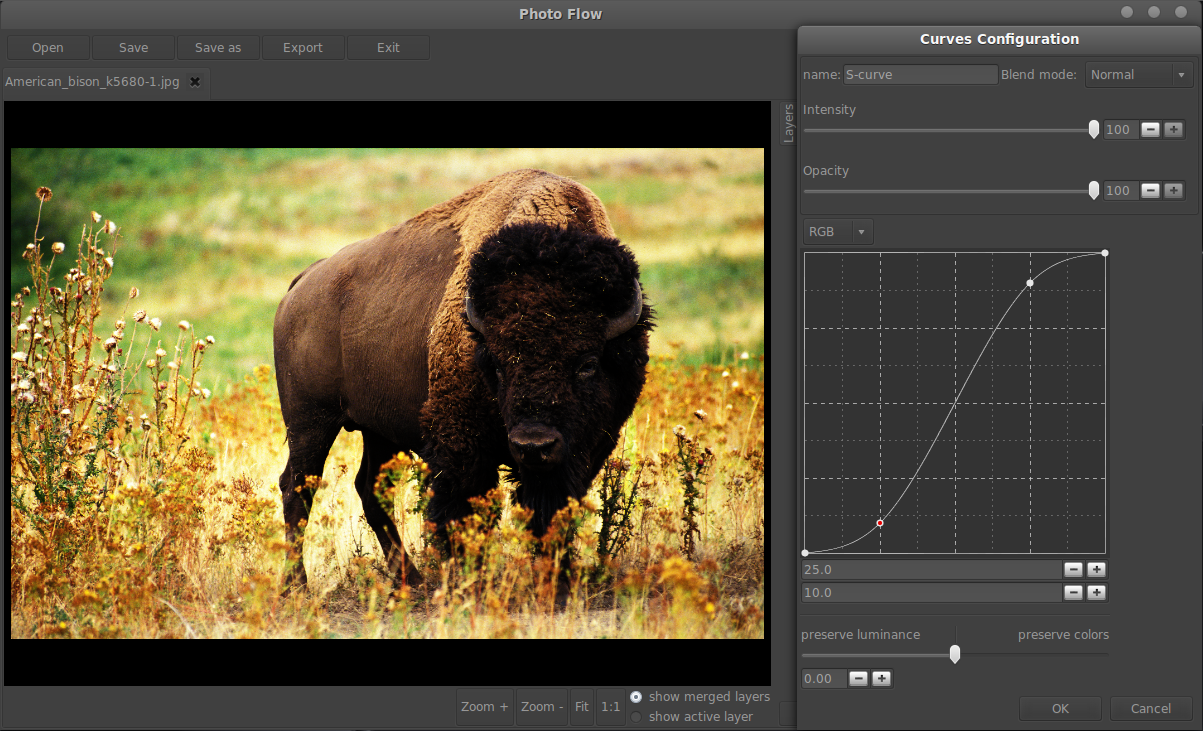
The top part of the configuration dialog contains a text box where you can define a custom name for the corresponding layer, a selector that lets you change the blending mode of the layer, and two sliders that allow to control the "strength" of the effect (I'll explain the difference between "Intensity" and "Opacity" a bit later).
Below the "strength" sliders you can see the graph where you can edit the curves, above which you can see a selector where you can specify on which channel the curve should be applied. When editing RGB images, you can apply the curve to all three RGB channels simultaneously (choosing the "RGB" option like in the image below) or a different curve for R, G and B (by choosing the corresponding option in the channel selector). If you are familiar with GIMP, "RGB" here corresponds to "Value" in GIMP.

In this example we will increase the overall contrast of the image by applying an S-shaped curve to all three RGB channels simultaneously. To create the first control point, click with your mouse at around 3/4 of the graph and drag the point upwards. You can also specify the position of the newly created control point by using the two numerical values below the curve: the first one sets the input value and the second one the output. I'll set the point to in=75 out=90.
Now we will create a second control point by clicking on the curve at around 1/4 of the graph and then dragging the point downwards (see below).

I've choosen to set the second point to in=25 out=10 so that the curve crosses the middle of the graph.
The result is shown below: the increase in contrast is way too strong, so we would need some way to "reduce" the effect until it looks ok... this is where the intensity and opacity sliders enter the game. If you move your mouse over the text in the image caption, you can see a comparison between the results obtained with 50% intensity, 50% opacity and a "weaker" S-curve.
S-curve result. Mouseover for
original S-curve,
weaker S-curve,
50% intensity
50% opacity
As you can see, setting the intensity to 50% is equivalent to dragging the control points halfway from the diagonal line (but much easier). In other words, lowering the intensity modifies the curve so that it gets closer to the diagonal in a way proportional to the intensity itself (the curve coincides with the diagonal when the intensity is set to 0%). On the other hand, the opacity value controls how the modified image should be mixed with the input one, according to the choosen alpha blending mode.
In this specific case, the blending mode is set to "Normal" and therefore the intensity and opacity have the same effect. In general however, the intensity acts on the pixel data BEFORE the alpha blending step, while the opacity controls the strength of the blending step itself.
Control points can also be added to the curve by directly clicking in the preview area while holding down the Ctrl-key. When you do that, the input image of the curves layer gets sampled in a small region around the clicked point and a new control point is automatically added at the right place along the curve.
Last but not least, control points can be removed by clicking on them with the right mouse button.
Curves, color and luminance
One of the bad side effects of any contrast adjustment applied to RGB images is that saturated colors tend to become even more saturated, frequently to the point where they look quite unnatural. The final image in this tutorial is not an exception to this rule, particularly in the yellow tints. However, photoflow provides a mechanism to migitage this effect.Several color adjustment tools in photoflow provide a slider that lets you control how much of the input color (or luminance) information is preserved in the modified image. Mathematically, this is obtained by making a transformation in an HSL-like (Hue, Saturation, Luminance) colorspace and then combining the luminance of the modified image with the hue and saturation of the input one (or vice-versa if you want to preserve the luminance of the input image). The original formulas used in photoflow can be found here.
In the specific case of the curves tool, this slider can be found at the bottom of the configuration dialog. By default, the cursor is in the middle of the slider and no transformation into HSL colorspace is perfromed. If you move the cursor to the right (towards the "preserve luminance" label) the colors of the input image will be preserved more and more, giving in our case an image with increased contrast but natural colors. If you move it to the left (towards the "preserve luminance" label) the luminance of the input image will be preserved, giving in our case the opposite effect (the original contrast but more saturated colors).
The images below show another example of over-saturated colors after a contrast enahncement, and the results obtained when preserving either the colors or the luminance of the original image. In each case, you can move your mouse over the image to see the original.

Contrast increased via S-curve (mouseover for original).

Contrast increased via S-curve, colors preserved (mouseover for original).

Contrast increased via S-curve, luminance preserved (mouseover for original).
It's time to finish this long tutorial... as you have seen, the curves tool in photoflow is rather powerful, and offers some options rarely found in other projects (for example, the possibility to set control points by numbers, or the additional colors/luminance control). It is probably the tool that I have implemented in the most complete way so far, and I'm still working to improve it further. It is also the tool I'm using more often for my own edits...
No comments:
Post a Comment